
AI Agents for Compelling Graphs - Comparison
AI Agents for Compelling Graphs - Comparison
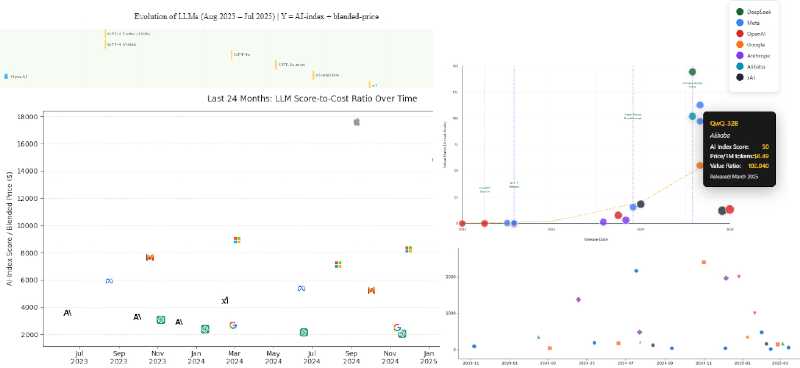
When it comes to evaluating the return on investment (ROI) of text models (aka Large Language Models), visual representations can be a game-changer. A well-structured graph can instantly highlight cost-efficiency trends, helping businesses make informed decisions. But which AI agent is best suited for this task?
We put seven leading AI agents: Anygen, Manus, Kimi K2, Genspark, Deepseek, WebOpenUI, and Copilot to the test, giving them the same prompt:
Generate a visual representation of the evolution of Large Language Models in time. The horizontal axis is the release date of each of the major LLM. On the vertical axis the LLM is positioned on the result of its AI Index score divided by its blended price in dollars. Each of data point is a small icon of the LLM. Consider the last 24 months for LLM release. Limit the total number of models to 30, from the major providers. Use the company’s icons to plot on the graph. Keep the look simple and clean. The source of information is the benchmark website: https://artificialanalysis.ai/leaderboards/models For release date use this website: https://nhlocal.github.io/AiTimeline/
The results varied dramatically: some delivered flawless visuals, others required manual intervention, and a few missed the mark entirely.
Key Findings: Performance Breakdown
Coding vs. Direct Visualization
- Copilot and Kimi K2 wrote Python code but required manual execution. Copilot needed logos to be downloaded, while Kimi inexplicably produced a Gantt chart instead of the requested scatter plot.
- OpenWebUI generated code that resulted in a runtime error (image too large).
- Anygen, Manus, and Genspark succeeded in producing visuals without user intervention.
Model Selection Inconsistencies
Each AI agent chose different LLMs for comparison:
| Model | Anygen | Manus | Kimi | Genspark | Copilot | OpenWebUI |
|---|---|---|---|---|---|---|
| OpenAI | ✓ | ✓ | ✓ | ✓ | ✓ | ✓ |
| ✓ | ✓ | ✓ | ✓ | ✓ | ||
| Anthropic | ✓ | ✓ | ✓ | ✓ | ✓ | |
| Meta | ✓ | ✓ | ✓ | ✓ | ✓ | |
| DeepSeek | ✓ | ✓ | ✓ | ✓ | ||
| xAI | ✓ | ✓ | ✓ | ✓ | ||
| Alibaba | ✓ | ✓ | ||||
| MiniMax | ✓ | |||||
| Mistral | ✓ | ✓ | ✓ | |||
| Microsoft | ✓ | |||||
| Apple | ✓ | |||||
| Cohere | ✓ | |||||
| AI21 | ✓ |
This inconsistency suggests varying interpretations of “major providers,” which could impact comparative analysis.
Visual Quality Ranking (Subjective Assessment)
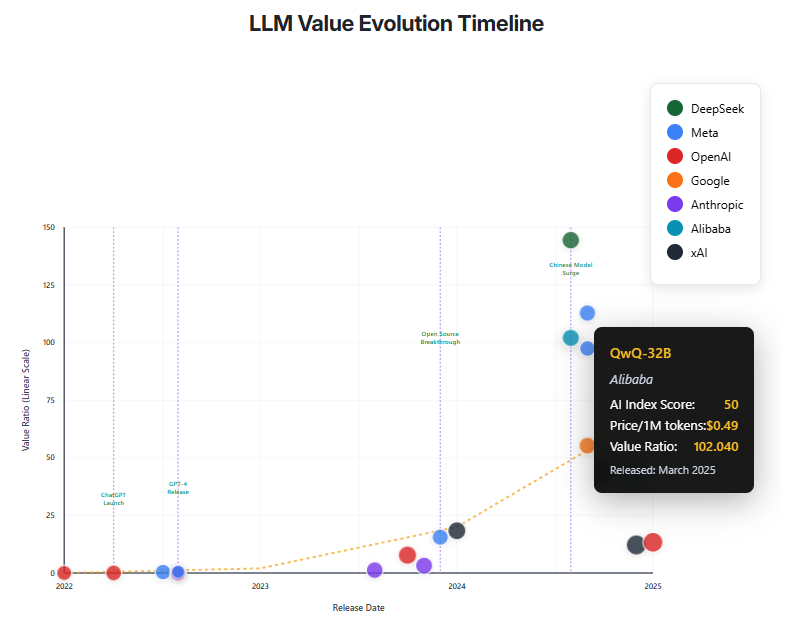
- Anygen – Interactive SVG-based graph, clean and intuitive.
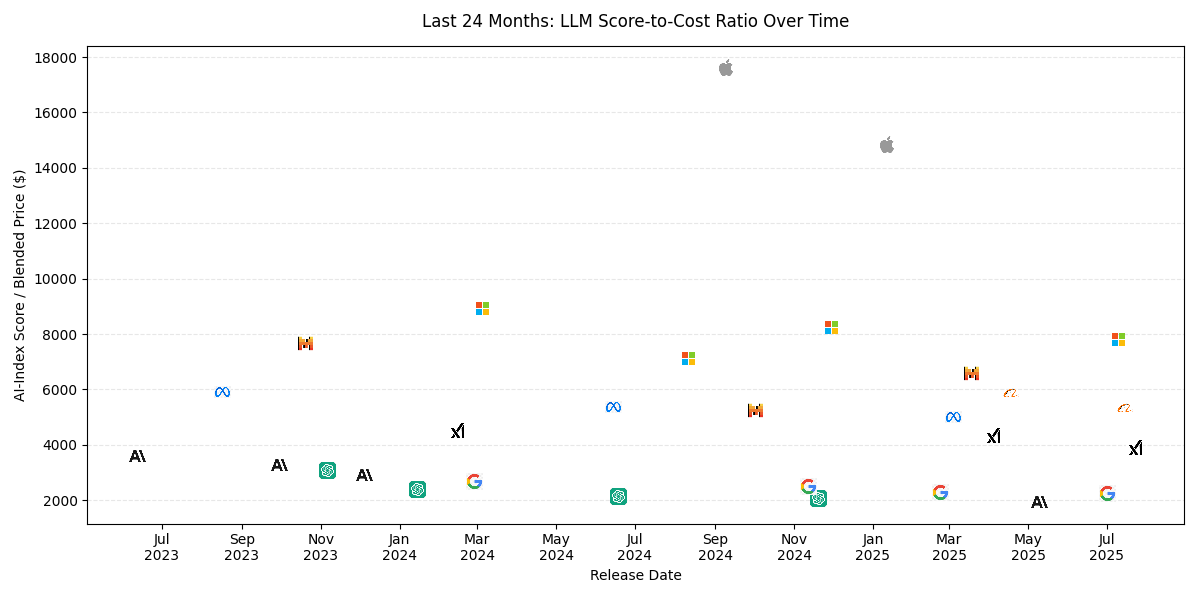
- Copilot – Used actual logos, enhancing clarity.
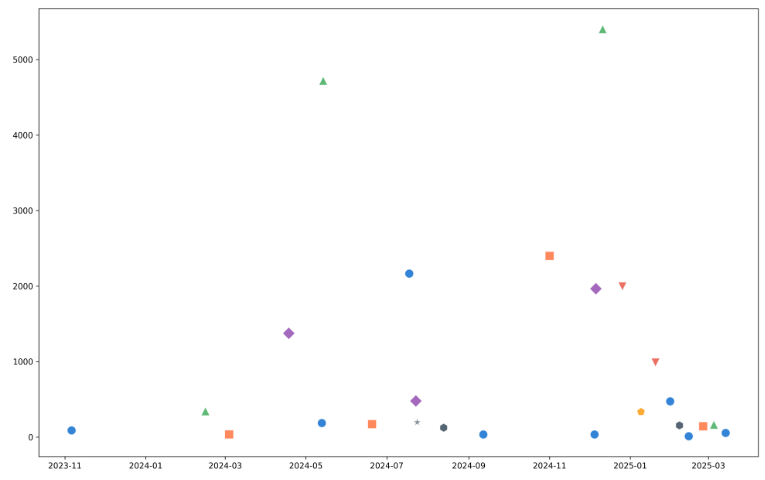
- Genspark – Simple and clean but lacked a color legend.
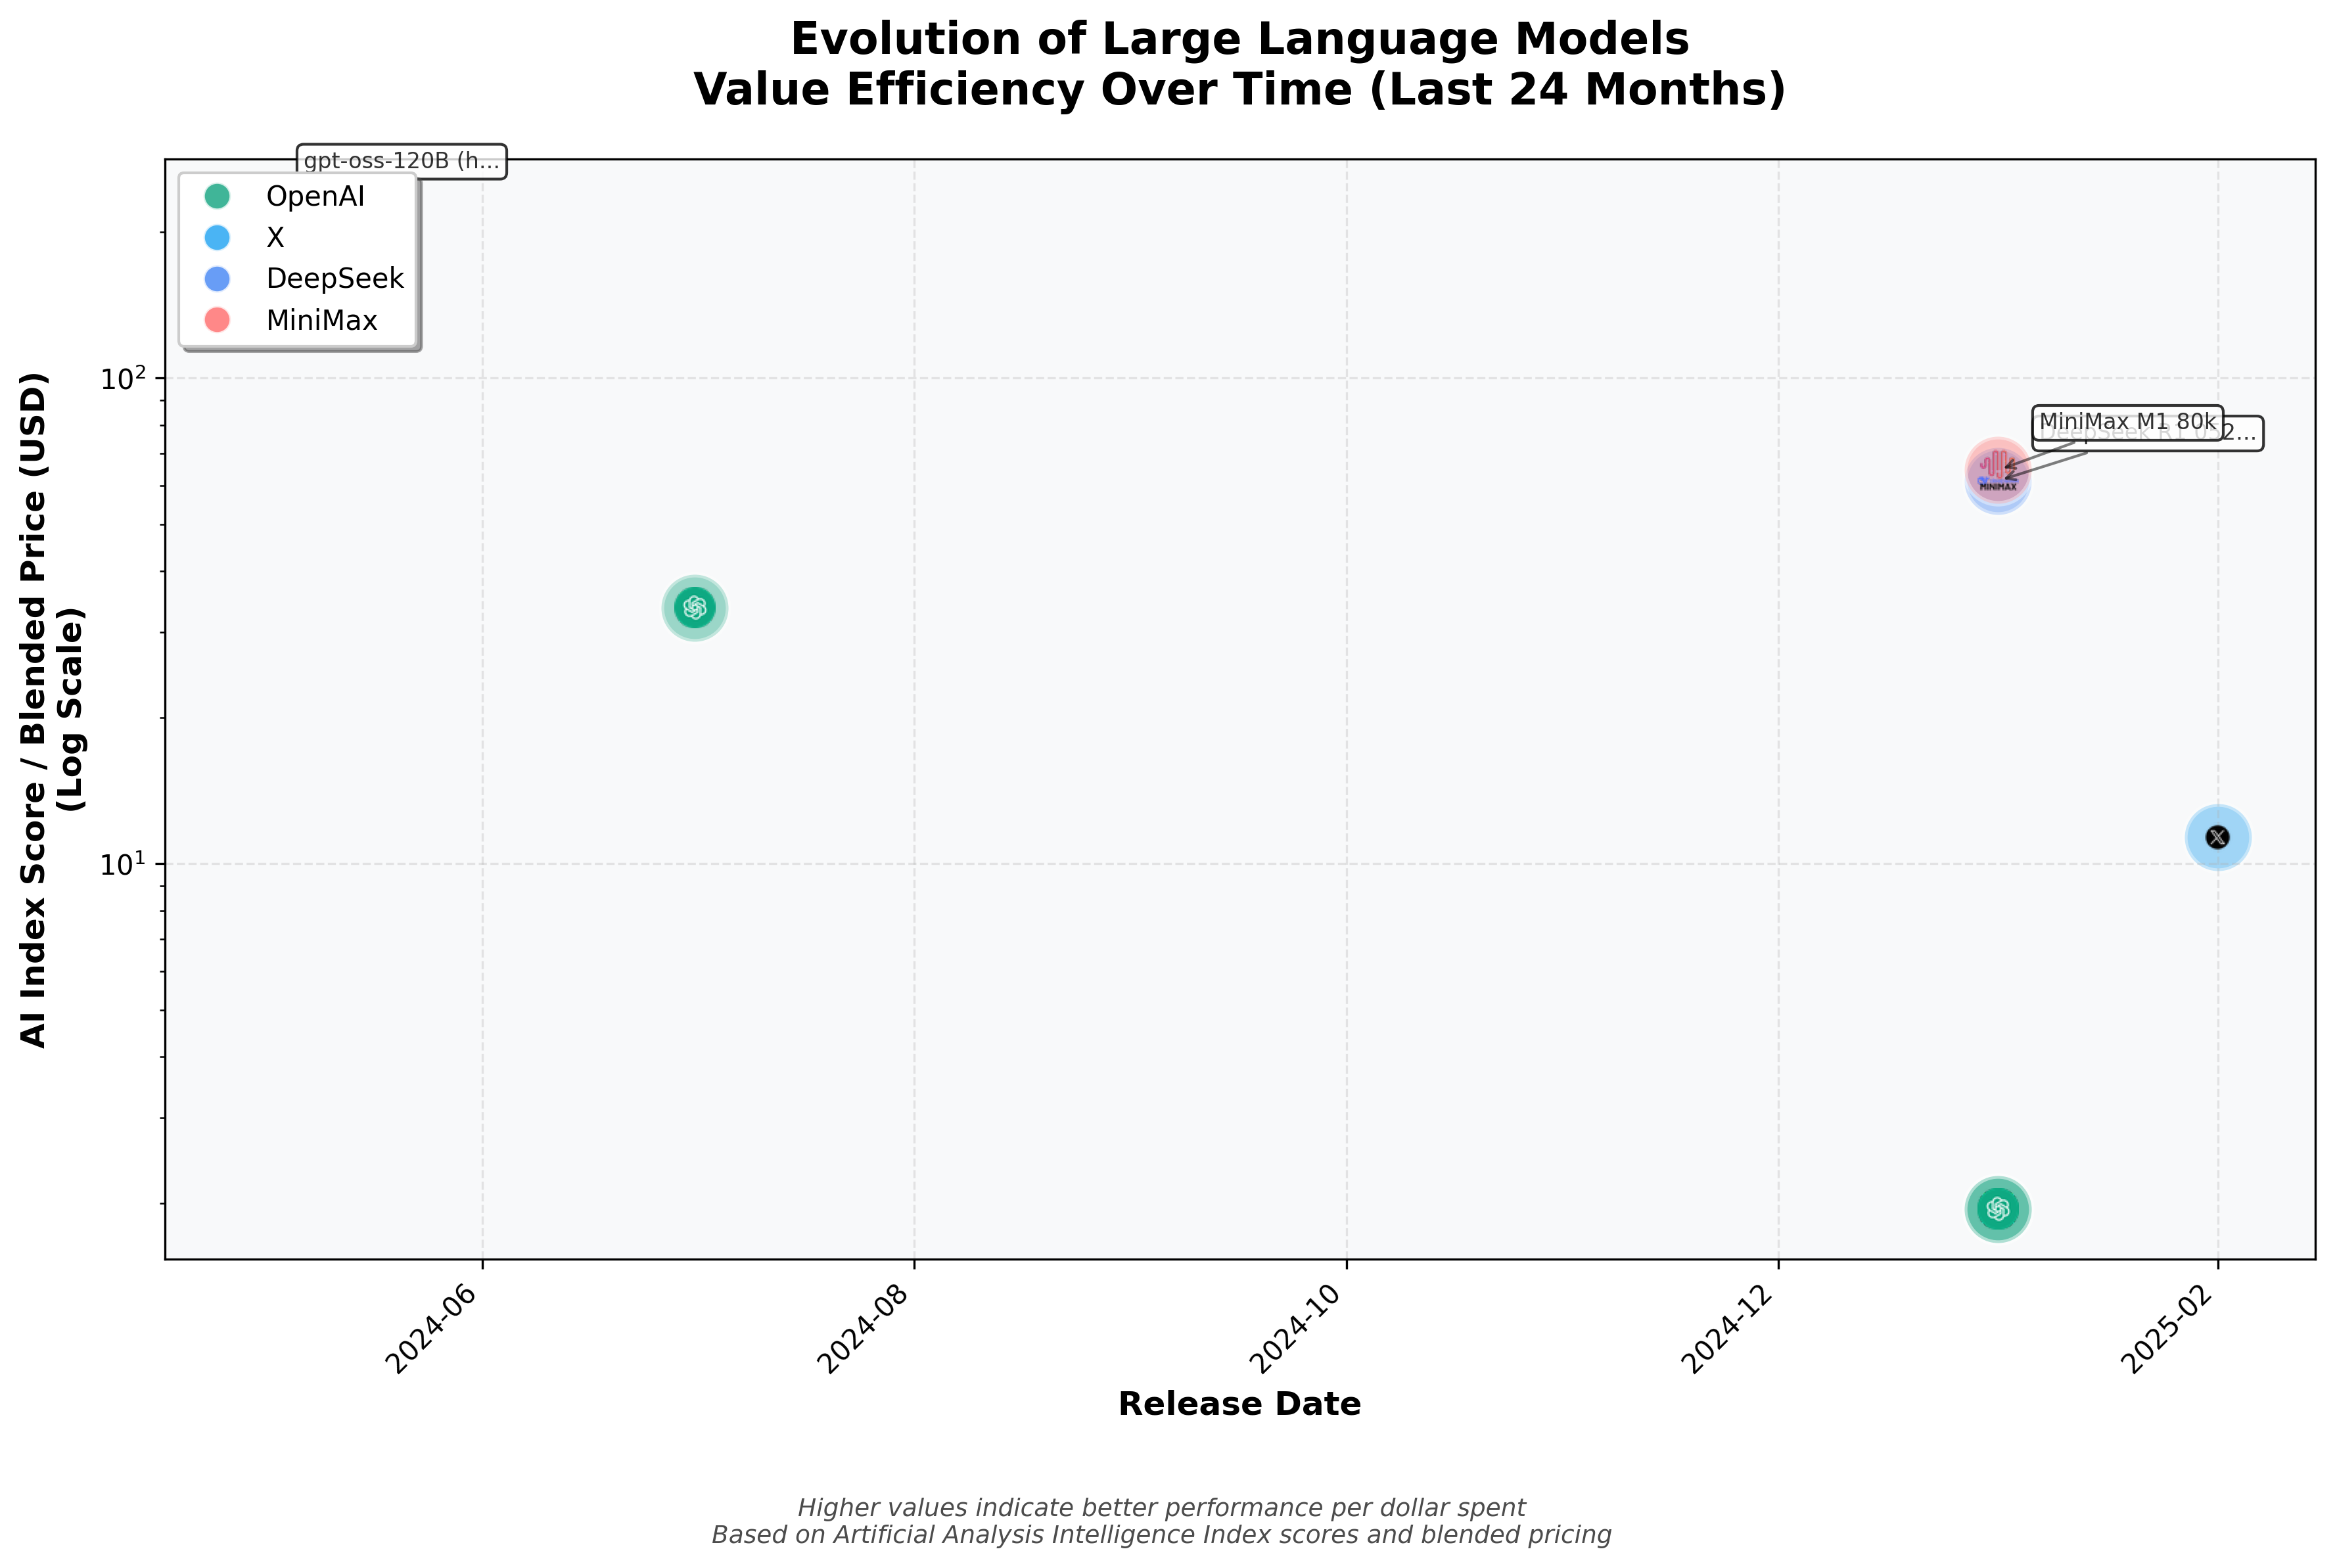
- Manus – Logarithmic scale (unrequested), messy presentation.
- OpenWebUI – Failed to render properly.
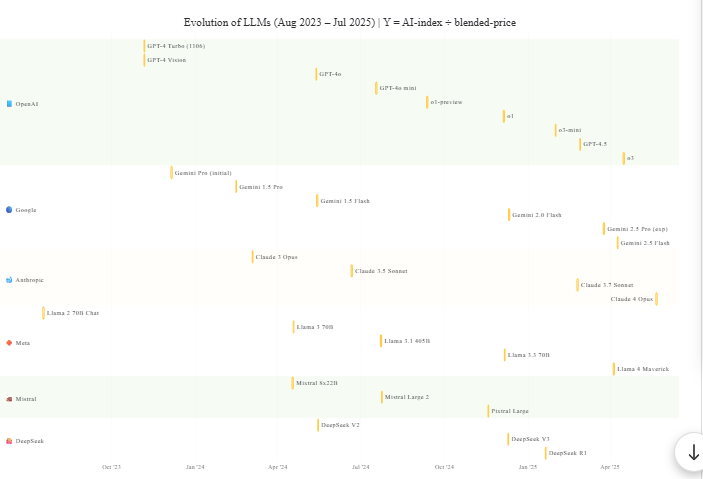
- Kimi K2 – Misinterpreted the task, delivering a Gantt chart.
Anygen
Copilot
Genspark
Manus
Kimi K2
Time-Saving Power of AI Agents
AI agents can dramatically reduce the time and effort required to create impactful visualizations—but only when they handle the entire workflow seamlessly. A truly effective agent compiles data from multiple sources, selects appropriate visual resources, and organizes everything into a consistent format—all without manual intervention. This end-to-end automation eliminates hours of tedious data wrangling and design work.
However, when agents deliver incomplete outputs, like OpenWebUI’s error-prone code requiring debugging or Copilot’s manual icon downloads, the promised efficiency evaporates. The time saved upfront is quickly lost in troubleshooting and tweaking, negating the value of automation. For businesses, the key is choosing agents that deliver fully executable visuals, turning raw data into decision-ready insights with zero friction.
The Accuracy Challenge
A critical limitation of text-based AI models is their notorious weakness in mathematical precision—even for simple calculations like dividing two numbers. Our test revealed stark inconsistencies in how different agents processed the same underlying data for GPT-4o. While the correct values were an AI score of 29, a price of $7.5 per million tokens, and a May-2024 release month (no exact date specified), the agents produced wildly divergent outputs:
- Anygen and Genspark got two right but botched the AI score (58 and 1405, respectively)
- Kimi K2 only captured the release date (May-13) while ignoring score and price
- Copilot failed on all three metrics (AI score: 95.1, price: $0.04, release: Jan-2024), because it did not perform any research. It hardcoded a bunch of data and asked the user to go and get the data from the websites.
- OpenWebUI and Manus excluded GPT-4o entirely, but looking at other models. OpenWebUI admits it cannot scrape the timeline website.
Notably, the May 13, 2024, release date, while technically correct, suggests agents ignored our provided source (which only listed the month) in favor of other data sources. This pattern likely explains the erroneous AI scores too. The takeaway? AI agents often prioritize plausible outputs over verified accuracy, undermining trust in automated visualizations. For business use cases, this demands rigorous manual validation—or agents with built-in fact-checking capabilities.
The Hidden Value
While the visualization itself is often the primary goal, some AI agents go further by delivering unsolicited but valuable market analysis—a feature that can save more time than the chart generation itself. The quality of these insights varies dramatically:
- Anygen stands out with integrated analytical overlays, highlighting key market periods and trends directly on the visualization.
- Genspark provides structured takeaways (e.g., “value champions,” market dynamics) that could inform strategic decisions.
- Manus offers only generic observations, adding little actionable value.
- OpenWebUI, Copilot, and Kimi K2 deliver no analysis at all, sticking strictly to the requested output.
If the underlying data is validated, these AI-generated insights can surpass an organization’s current analytical capabilities, uncovering patterns or efficiencies that might otherwise go unnoticed. For businesses, this means two potential ROI streams: the visualization itself and the agent’s interpretive layer. The best agents don’t just plot data—they extract meaning, turning raw numbers into strategic guidance.
Key Takeaways
Our testing reveals critical differences in AI agents’ capabilities:
Visualization Quality Varies Widely
- Top performers: Anygen delivers interactive, clean outputs; Copilot provides structured, brand-aware visuals.
- Avoidable pitfalls: Kimi’s misinterpretations and Manus’s unwarranted logarithmic scales undermine usability.
Unexpected Value in AI-Generated Analysis
Advanced agents like Anygen and Genspark offer unsolicited but actionable insights—transforming raw data into strategic guidance that can surpass manual analysis.
Data Integrity is Non-Negotiable
- Every agent made errors in data collection, proving that automated scraping of even trusted sources is unreliable.
- The solution: Curate clean input data manually. Specifying sources helps but doesn’t guarantee consistency (as seen with divergent GPT-4o metrics).
No agent replaces human validation. Always audit sources, calculations, and visual logic, especially for ROI-critical decisions.
We are Here to Empower
At System in Motion, we are on a mission to empower as many knowledge workers as possible. To start or continue your GenAI journey.


Let's start and accelerate your digitalization
One step at a time, we can start your AI journey today, by building the foundation of your future performance.
Book a Training