
Your BI Is a History Lesson. AI Is Writing the Future.

Your BI Is a History Lesson. AI Is Writing the Future.
The Gift BI Gave Business — and the Debt It Left Behind
Before Business Intelligence, decisions were made the old way: a manager with the most tenure, the loudest voice, or the biggest title decided. Data, when it existed at all, lived in filing cabinets, on mainframe printouts, or inside the heads of the few who kept the books.
Then came the 1990s — and everything changed.
In 1996, Gartner analyst Howard Dresner introduced the term Business Intelligence, defining it as “a set of concepts and methods to improve business decision-making by using fact-based support systems.” For the first time, organizations had a formal framework for what many had been doing informally: collecting operational data from ERP, CRM, and finance systems, transforming it into information, and delivering it to the people who needed it. Dresner’s definition wasn’t just a label — it was a paradigm shift. It said: decisions should be based on facts, not feelings. ( Gartner Group via CIO.com )
The impact was profound. Companies that embraced BI could suddenly see patterns that were invisible before. A regional manager could compare sales across territories in real time. A CFO could track margins by product line without waiting for month-end. Supply chain leaders could spot bottlenecks before they became crises. SAS’s IIA research confirms that organizations investing in BI consistently report better data-driven decision-making as the primary benefit — the ability to look at what’s actually happening rather than what someone thinks is happening.
BI didn’t just change what decisions were made. It changed who could make them. For the first time, data wasn’t the exclusive domain of the C-suite. A mid-level operations manager with the right dashboard could challenge a senior leader with facts. That democratization of information was genuinely revolutionary.
But every revolution creates new dependencies. And the dependency BI created — the one nobody talked about during the vendor demo — was about to become a problem.
The Promise vs. The Reality
If you’ve ever sat through a BI vendor demo, you know the pitch. Someone on a stage, smiling confidently, opens a clean interface. They drag a field onto a canvas. A chart appears. They apply a filter. It updates instantly. They click “Share.” The audience nods. Five minutes — and you have a fully functional report that would have taken your IT team three weeks to build.
The demo isn’t lying. It’s just showing you the last five minutes of a six-month process.
BI Architecture
Behind that effortless drag-and-drop interface sits an architecture that has to be built, populated, tested, secured, and maintained before a single business user ever sees a dashboard. Data warehouses need to be designed. ETL pipelines need to extract, transform, and load data from dozens of source systems — each with its own schema, its own quirks, its own version of “the truth.” OLAP cubes need to be structured so queries return results in seconds instead of hours. Access controls need to be configured so the right people see the right data — and no one sees what they shouldn’t.
This is the reality: BI was sold as a tool for business users, but it ended up in the hands of BI Specialists.
The Line for Your Next Repoert
If you want a new report, or want to tweak an existing KPI, add a filter, change a grouping, or adjust a time horizon — you don’t open the tool. You open a ticket. You explain what you need to someone who understands both the data model and the business logic. They build it. They test it. They push it to production. You wait. In organizations with mature BI practices, this process takes days. In most organizations, it takes weeks.
The business user who was promised self-service becomes a consumer of pre-built reports, dependent on a team of specialists who understand the data warehouse schema, the ETL dependencies, and the hundred small decisions that determine whether a number on a dashboard is accurate or misleading.
System Beside the System
And the system itself, the one that was supposed to simplify your data landscape, becomes a system beside the systems. Not embedded in your workflow. Not integrated into the tools your teams use daily. A separate platform with its own infrastructure, its own upgrade cycles, its own maintenance windows, its own refactoring backlog when the underlying data sources change.
The lightweight promise becomes the heavy reality: more servers to maintain, more licenses to renew, more upgrades to schedule, more specialists to hire. The very technology that was supposed to accelerate decision-making begins to slow it down — not because it’s badly built, but because it’s built on the assumption that data should be centralized, standardized, and structured before it can be useful.
That assumption was reasonable in 1996. It is increasingly expensive in 2026.
Where BI Hits Its Ceiling
Let’s be precise about the limits. Not the limits of a bad implementation — the limits of the architecture itself.
| What BI Claims | What Actually Happens |
|---|---|
| Self-service for business users | IT tickets, BI specialists, report queues |
| Real-time insights | Batch-processed, refreshed overnight or weekly |
| One source of truth | Dashboards that disagree with each other |
| Handles all your data | Only structured data that fits the schema |
| Scales with your business | Slows down as data volume and user count grow |
Every row in that table comes back to one root cause: BI can only process structured, standardized data.
Structural Rigidity
Your data warehouse has a schema. Your ETL pipeline has rules. Your OLAP cube has dimensions. Anything that wants to enter the BI system must first be cleaned, formatted, mapped, and squeezed into a predefined structure. Numbers in columns. Categories in dropdowns. Dates in the right format. If it fits, it flows. If it doesn’t fit — it doesn’t get processed at all.
And most of your business doesn’t fit.
The customer complaint buried in a support email. The contract clause flagged in a PDF. The competitor rumor spreading through a sales team’s chat messages. The exit interview where a departing employee finally tells the truth. The voice note from a client meeting. The market signal hiding in a social media thread. This is where decisions actually live — in unstructured, heterogeneous, messy human communication — and BI cannot touch it at scale.
So where does that data go?
Excel
The irony is almost perfect. The organization invests millions in a BI platform to eliminate spreadsheet chaos — and the spreadsheet chaos simply moves one layer down. The analyst who needs to include “the stuff that doesn’t fit” exports the dashboard data into Excel, pastes in the exceptions, the qualitative notes, the manual adjustments, the numbers from the other system that was never integrated. They build their own shadow model. They email it around. Someone else downloads it, modifies it, re-sends it. Version 7_FINAL_v2.xlsx.
Your organization now operates three layers of data manipulation:
- The Systems — ERP, CRM, finance. Where transactions happen.
- The BI Layer — the warehouse, the dashboards, the official truth.
- The Excel Layer — where the actual decisions get made, because it’s the only place where structured and unstructured reality can coexist.
Each layer introduces delay. Each handoff introduces inconsistency. Each manual step introduces human error. And the Excel layer — the one closest to the decision — is the least governed, least auditable, and most fragile of all.
The CFO looking at the official dashboard and the regional director looking at their spreadsheet are not looking at the same business. One of them is wrong. Often, both are.
This is not a training problem. It is not a discipline problem. It is an architecture problem. A system designed for structured data in a world that runs on unstructured reality will always leak.
Information-Rich, Insight-Poor
Here is the uncomfortable truth that Gartner, the very firm that gave Business Intelligence its name, has made explicit: BI is, by definition, a technology of hindsight.
Gartner’s own glossary classifies traditional BI under Descriptive Analytics : “the examination of data or content, usually manually performed, to answer the question ‘What happened?’ (or ‘What is happening?’), characterized by traditional business intelligence (BI) and visualizations such as pie charts, bar charts, line graphs, tables, or generated narratives.”
Read that again. The company that named the technology also labeled its ceiling: What happened? Not why it happened. Not what happens next. And certainly not what you should do about it.
This is not a criticism of a flawed product. It is a description of a completed one. BI was built to answer one question — and it answers it well. The problem is that your business no longer has the luxury of asking only one question.
The backward-looking cost
By the time a trend appears on your dashboard, it has already happened. The dashboard is a history lesson — accurate, well-formatted, and too late. A margin drop flagged in Q3 started in Q2. A client’s declining engagement visible in this month’s report was visible in their tone three months ago — in emails your BI system never read. You are steering the business by looking in the rearview mirror.
The interpretation bottleneck
BI surfaces numbers; humans must still convert them into decisions. This means your most experienced people — the ones whose judgement is scarcest and most expensive — spend their time reading reports instead of acting on insights.
If you run a professional services firm, your BI tells you utilization rates, realization rates, and billable hours by practice area. What it cannot tell you: which associate is quietly heading toward burnout, which client relationship is cooling, or how to rebalance workload across teams next week. The gap between knowing and doing is exactly where your margin leaks.
If you lead transformation, you’ve built the dashboards. You have KPIs for everything. But when the CEO asks “What should we do about the pipeline?” — your dashboard is silent. You are information-rich and insight-poor, and every quarterly review makes the gap more visible.
The ladder BI never climbed
IBM’s analytics framework lays out four tiers of decision-making value — and it shows precisely where BI stops:
| Tier | Question | Technology | Decision Value |
|---|---|---|---|
| Descriptive | What happened? | BI / dashboards | Hindsight |
| Diagnostic | Why did it happen? | BI + drill-down | Understanding |
| Predictive | What might happen next? | ML / forecasting | Foresight |
| Prescriptive | What should we do next? | AI / optimization | Action |
BI lives on the first rung. It can stretch to the second with enough drill-downs and analyst hours. But the climb from understanding to action — the climb from a report to a recommendation — is a different architecture entirely. It requires technology that reads what BI cannot read, reasons over what it cannot structure, and answers the question BI was never designed to ask: What should we do next?
The human still decides. But a human deciding with hindsight is competing against a human deciding with foresight. And that is not a fair fight.
The Human Decides — But the Human Deserves Better Tools
Let’s be clear about something: the answer is not to replace the decision-maker. The answer is to stop forcing the decision-maker to be a data archaeologist.
The problem was never that BI was bad technology. The problem is that the decision-making environment has outgrown it. The volume of data has exploded. The speed of business has accelerated. The complexity of decisions, 65% more complex than two years ago, according to Gartner, has outpaced any dashboard’s ability to keep up.
More dashboards won’t help. More reports won’t help. You don’t need a better rearview mirror. You need a co-pilot.
The shift from reporting to recommending
This is where AI agents enter, not as a replacement for human judgement, but as the infrastructure that makes human judgement scalable.
| BI Today | AI Agents Tomorrow |
|---|---|
| Embedded beside the workflow | Embedded in the workflow |
| Processes structured data only | Reads structured + unstructured data |
| Reports what happened | Recommends what to do next |
| Requires specialist maintenance | Adapts to your systems daily |
| Creates Excel workarounds | Eliminates the workaround layer |
| Batch-processed, stale | Real-time, continuous |
The difference is architectural. BI asks you to bring the data to it — cleaned, structured, standardized. AI agents meet the data where it lives — in emails, in documents, in conversations, in the messy reality of your business.
What this looks like in practice
For the professional services firm: An AI agent reads engagement emails, reviews project documents, tracks utilization patterns across the practice, and surfaces not just “Associate X is at 85% utilization” but “Associate X is showing signs of overload based on email response times and project complexity — consider redistributing the Johnson account to Associate Y, who has capacity and relevant experience.”
For the transformation leader: Instead of a dashboard showing pipeline metrics, an AI agent synthesizes market signals, internal capacity, and historical patterns to recommend: “The APAC expansion is at risk due to regulatory delays — here are three mitigation options with projected impact.”
Start Where It Hurts
You don’t need to dismantle your BI infrastructure. You don’t need a multi-year transformation roadmap. You need one function, one workflow, one decision point where the gap between what happened and what to do next is costing you real money — or real people.
That’s where you start.
If you lead transformation, you’ve already built the dashboards. Now build the decision engine. Pick the process where your best people are drowning in data but starving for insight — the one where Excel workarounds are the norm, not the exception. In four weeks, that function can move from BI reporting to AI-driven action. Book a 30-minute Demo of our AI-powered Dashboards and we’ll map the shortest path.
The era of waiting is over. The era of daily reinvention is here.
Your dashboard is a history lesson. Your competition is reading the future.
Which one will you act on?
FAQ for Executives
Q1: What are the fundamental limitations of Business Intelligence for executive decision-making?
A: Business Intelligence is architecturally limited to descriptive analytics — it answers “What happened?” but not “What should we do next?” Gartner classifies BI as descriptive technology, meaning it processes historical data to generate reports, dashboards, and visualizations. The fundamental limitations include: inability to prescribe actions, dependence on structured data only, batch processing that creates latency between events and insights, and the requirement for specialized IT staff to build and maintain reports. For executives facing decisions with 65% more complexity than two years ago (per Gartner), BI provides hindsight when foresight is required.
Q2: Why did Business Intelligence fail to deliver on its promise of self-service analytics?
A: BI was marketed as drag-and-drop simplicity for business users, but the reality required specialized infrastructure: data warehouses, ETL pipelines, OLAP cubes, and governance frameworks. The “five-minute demo” masked a six-month implementation. Business users discovered that modifying a KPI, adding a filter, or adjusting a time horizon required opening IT tickets rather than opening the tool. BI became “a system beside the systems” — requiring dedicated specialists, maintenance cycles, and refactoring. The self-service promise collapsed because BI architecture assumes data must be centralized, standardized, and structured before it can be useful — an assumption that creates dependency on technical intermediaries.
Q3: What is the “three-layer data chaos” problem in enterprise analytics?
A: The three-layer data chaos describes how organizations actually operate: Layer 1 is transactional systems (ERP, CRM, finance) where data is generated; Layer 2 is the BI platform (data warehouse, dashboards) where official reports live; Layer 3 is Excel, where actual decisions get made. Because BI cannot process unstructured data — emails, PDFs, chat messages, qualitative feedback — anything that doesn’t fit the schema gets exported to spreadsheets. This creates shadow databases, version control nightmares (“V7_FINAL_v2.xlsx”), and decision-makers looking at different versions of truth. Each layer introduces delay, inconsistency, and human error. The Excel layer, closest to decisions, is least governed and most fragile.
Q4: How do AI agents differ from Business Intelligence in decision support?
A: AI agents represent a categorical shift from reporting to recommending. While BI processes only structured, standardized data to describe what happened, AI agents read both structured and unstructured data — emails, documents, conversations — to recommend what to do next. BI is embedded beside the workflow (requiring separate maintenance, upgrades, and specialist teams); AI agents are embedded in the workflow. BI creates Excel workarounds; AI agents eliminate them. The architectural difference is fundamental: BI requires you to bring data to it, cleaned and structured; AI agents meet data where it lives, in the messy reality of business operations.
Q5: What is the difference between descriptive, predictive, and prescriptive analytics?
A: IBM’s analytics framework defines four tiers of decision value: Descriptive analytics (What happened?) uses BI and dashboards to provide hindsight. Diagnostic analytics (Why did it happen?) adds drill-down capability for understanding. Predictive analytics (What might happen next?) uses machine learning and statistical models for foresight. Prescriptive analytics (What should we do next?) uses AI and optimization to recommend specific actions. Business Intelligence lives on the first rung — descriptive — and can stretch to diagnostic with significant analyst effort. The climb to predictive and prescriptive requires different technology: AI agents that can read unstructured data and reason over complexity that exceeds dashboard capabilities.
Q6: Why is unstructured data critical for modern business decision-making?
A: Unstructured data — emails, PDFs, voice notes, chat messages, social media, exit interviews — contains the context, nuance, and early signals that structured data misses. Customer complaints buried in support emails, contract risks flagged in legal documents, competitor intelligence spreading through sales team chats, and employee sentiment revealed in conversations: this is where decisions actually live. BI cannot process this data at scale, so it flows into Excel workarounds or gets ignored entirely. AI agents can synthesize unstructured data at scale, converting qualitative signals into quantitative recommendations. Organizations relying solely on structured BI data are making decisions with partial information — the equivalent of reading every other page of a novel.
Q7: How does the complexity of modern executive decisions exceed BI capabilities?
A: Gartner reports that 65% of executives say their decisions are more complex than two years ago, and 53% face more pressure to justify those decisions. Modern decisions involve more variables, faster timeframes, cross-functional dependencies, and higher stakes. BI was designed for a slower era: batch-processed data, stable schemas, and hierarchical decision-making. Today’s executives need to synthesize market signals, operational constraints, human factors, and competitive dynamics in real time. A dashboard showing last month’s metrics cannot answer “What should we do about the APAC expansion given regulatory delays and supply chain risks?” That requires prescriptive analytics — AI agents that can model scenarios, weigh tradeoffs, and recommend actions.
Q8: What are the hidden costs of maintaining Business Intelligence infrastructure?
A: The hidden costs include: dedicated BI specialists to build and maintain reports; data warehouse infrastructure (servers, licenses, cloud costs); ETL pipeline development and maintenance; schema refactoring when source systems change; upgrade cycles and testing; governance committees to resolve dashboard discrepancies; and the opportunity cost of delayed decisions. Most significantly, BI creates a “ticket culture” where business users wait days or weeks for report modifications, slowing organizational responsiveness. The system that promised to accelerate decision-making becomes a bottleneck — a “system beside the systems” that requires its own ecosystem of support rather than simplifying the existing one.
Q9: How can professional services firms overcome BI limitations in resource management?
A: Professional services firms face specific BI limitations: dashboards show utilization rates and billable hours but cannot predict burnout, identify at-risk client relationships, or recommend workload rebalancing. AI agents address this by reading engagement emails, reviewing project documents, tracking communication patterns, and synthesizing qualitative signals. Instead of reporting “Associate X is at 85% utilization,” an AI agent recommends: “Associate X shows signs of overload based on email response latency and project complexity — consider redistributing the Johnson account to Associate Y, who has capacity and relevant domain experience.” This converts retrospective reporting into proactive resource optimization, protecting both margin and talent.
Q10: What is the strategic advantage of private AI deployment over public API services?
A: Private AI deployment — running AI agents inside your own infrastructure rather than sending data to public API services — addresses three executive concerns: data security (no sensitive information leaves your environment), compliance (full control over data residency and audit trails), and competitive differentiation (your AI learns your business without training competitors’ models). For professional services firms with client confidentiality obligations, regulated industries with compliance requirements, or any organization with proprietary processes, public API AI creates unacceptable risk. Private deployment ensures that your AI agents become a durable competitive asset rather than a shared utility.
Q11: How should executives evaluate the transition from Business Intelligence to AI-driven decision support?
A: Executives should evaluate this transition on four dimensions: (1) Data scope — Can the system process unstructured data where decisions actually live? (2) Workflow integration — Is intelligence embedded in daily tools or isolated in separate dashboards? (3) Decision velocity — Does the system recommend actions in real time or report history in batches? (4) Maintenance burden — Does the system adapt to changing data sources or require constant refactoring? The transition is not rip-and-replace; it is evolution. Start with one function where the gap between information and action is measurable — where Excel workarounds are the norm — and prove value in four weeks before expanding.
Q12: Why do traditional BI implementations create dependency on Excel spreadsheets?
A: BI creates Excel dependency because of architectural mismatch: BI systems require structured, standardized data, but business reality is unstructured and heterogeneous. When data doesn’t fit the schema — the customer email, the contract clause, the qualitative feedback — analysts export dashboard data to Excel and manually paste in exceptions, adjustments, and context. This creates shadow models, version chaos, and decision-makers working from different numbers. The irony is that BI was sold to eliminate spreadsheet chaos; instead, it pushed chaos one layer down. The Excel layer persists because it’s the only place where structured BI output and unstructured business reality can coexist — until AI agents eliminate the need for that workaround entirely.
Q13: What is the “dashboard paralysis” problem and how does AI solve it?
A: Dashboard paralysis describes the condition where organizations have abundant metrics but insufficient insight — more data, more dashboards, more confusion. Executives face information overload without decision clarity: which metric matters most, what caused the variance, what action should follow. BI compounds this by generating more reports without recommending priorities. AI agents solve dashboard paralysis by synthesizing across data sources, identifying signal in noise, and recommending specific actions with projected impact. Instead of presenting ten KPIs for human interpretation, an AI agent states: “Three factors drove the margin decline; here are two mitigation options ranked by expected ROI.” This converts information abundance into decision clarity.
Q14: How do modular AI agents differ from monolithic enterprise AI platforms?
A: Modular AI agents are designed for specific functions, workflows, or decision points — they adapt to your processes rather than forcing you to adapt to theirs. Monolithic platforms promise comprehensive transformation but require lengthy implementation, organizational change management, and significant upfront investment. Modular agents start small: one function, one workflow, four-week proof of value. They integrate with existing systems rather than replacing them. They scale organically — each success builds momentum for the next. This approach aligns with how organizations actually change: incrementally, with proof points, building confidence through execution rather than betting on intention. Modular AI agents turn AI from a multi-year transformation program into a series of immediate operational improvements.
Q15: What questions should CEOs ask to assess their organization’s readiness for AI-driven decision-making?
A: CEOs should ask: (1) Where do our best people spend time reading reports instead of acting on insights? (2) How many Excel workarounds exist between our official dashboards and actual decisions? (3) What unstructured data — emails, documents, conversations — contains signals we’re currently ignoring? (4) How long does it take from identifying a problem to implementing a solution, and where does that delay live? (5) If our competitors could predict our next quarter’s challenges while we’re still analyzing last quarter’s results, what would that be worth? These questions reveal the gap between information and action — the space where AI agents create immediate value. The readiness signal is not technical infrastructure; it is organizational pain where data abundance meets decision scarcity.
We are Here to Empower
At System in Motion, we are on a mission to empower as many knowledge workers as possible. To start or continue your GenAI journey.
You should also read
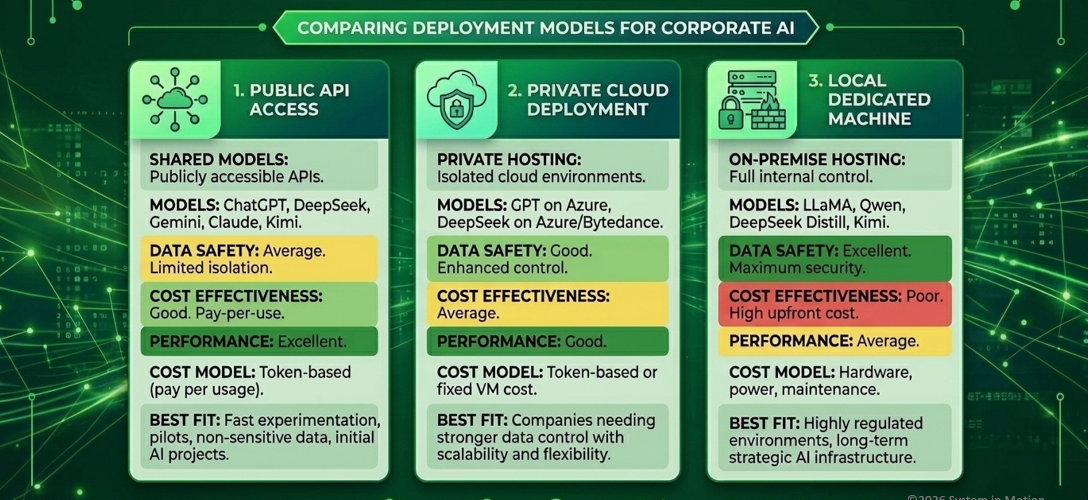
Where Should Your Company Run AI? Public API, Private Cloud or On-Premises
Article 25 minutes readLet's start and accelerate your digitalization
One step at a time, we can start your AI journey today, by building the foundation of your future performance.
Book a Training